Easter Sunday is coming up so our team has no open houses this Sunday. Stay tuned, we have 5 new listings coming on next week!
We thought we would share some stats from The Casey Samson Team: 4 out of the last 6 listings we put on SOLD at the open house and we have the buyers! 12 days is our average days on the market. 40 out of the 45 homes we listed since the election have sold or are under contract!
What is your Market like?
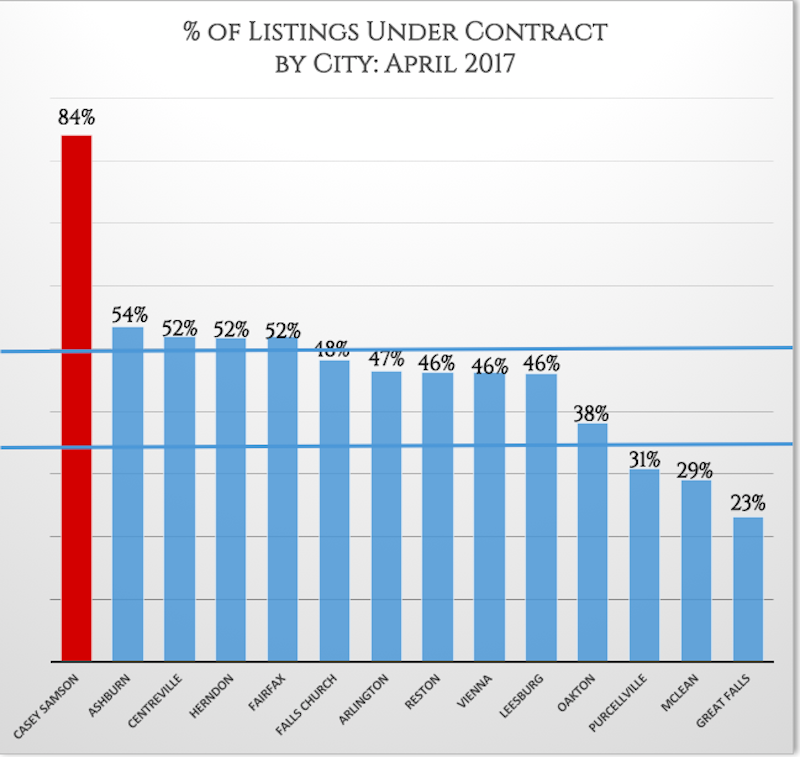
Sellers need to know how the market is reacting so they can adjust their strategy. % of homes under contract dictate Buyer’s or Seller’s Markets
Under 33% is a Buyer’s Market, 33%-50% is a Neutral Market, 50% and above denotes a Seller’s Market.
Each town has it’s own dashboards and charts that give sellers a better look at their particular market. Charts are dynamically updated so sellers have the best information available. They include:
- Closed Sales compared to the 5 year average
- New Pending (homes under contract) vs 5 year average shows us buyer activity.
- Active Listings vs 5 year average talks to the current inventory.
- Months of supply vs 5 year average tells us whether we are in a sellers market or a buyers market and has a direct effect on pricing.
How is your market doing?
Select your town from the menu or the link above.
If you want your market update added, let us know at casey@caseysamson.com.